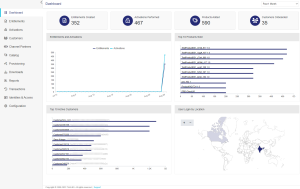
Dashboard
|
New to Sentinel EMS?
|
Overview
The dashboard page displays metrics and charts that provide an instant visibility into Sentinel EMS operations. The information displayed on the dashboard page, such as top 10 products sold or number of activations performed over a time period, can act as an indicator for analyzing and monitoring Sentinel EMS data. With a quick insight into common entitlement management functions, dashboard enables vendor administrators in identifying products that are delivering more value to customers, exploring locations of customers' interests, and measuring the overall progress.
Filter by Time Interval
You can filter the dashboard information based on the following time intervals:
>Past 1 Month
>Past 1 Week
>Past 1 Day
>Past 1 Hour
By default, the dashboard page displays data for the past 1 month.
Dashboard Data
The various metrics and charts available on the dashboard page are:
>Entitlements Created: The total number of entitlements that are created (excluding draft entitlements) in the given time interval.
>Activations Performed: The total number of product activations that are performed in the given time interval.
>Products Added: The total number of products that are created in the given time interval.
>Customers Onboarded: The total number of new customers added to Sentinel EMS in the given time interval.
>Entitlements and Activations: A multiple line graph that depicts the comparison of number of entitlements created (excluding draft entitlements) and number of activations performed daily in the given duration. Hovering over a data point displays the total number of entitlements versus activations for a particular day (if filtered by Past 1 Month or Past 1 Week) or for a particular time of the day (if filtered by Past 1 Day or Past 1 Hour).
>Top 10 Products Sold: A bar chart that provides visibility into 10 most popular products based on the quantity sold over a specified time interval. Hovering over a bar displays product name and quantity sold. This information is helpful in identifying which products are selling well and related upsell and cross-sell opportunities.
>Top 10 Active Customers: A bar chart that displays the top 10 customers by the quantity purchased over a specified time interval. Hovering over a bar displays the customer name, customer identifier, and the quantity purchased. This information provides valuable insights into customers' behavior and preferences.
>User Login by Location: Helps in identifying the geographical locations where Sentinel EMS is being accessed by users across vendor portals and customer portals during the specified time interval. You can hover over a location to view the numbers of users who visited from that area.

